Forum Replies Created
-
AuthorPosts
-
pidtuner
KeymasterHi, thank you for using pidtuner.
To help us help you better, it would be useful if you share your pidtuner project link with us.
In the meanwhile, take a look at this presentation to check if you have done all the steps correctly:
https://github.com/pidtuner/pidtuner.github.io/blob/master/assets/doc/PID%20Tuner.pdf
KeymasterHi,
Thank you for using pidtuner. Looking at your data, it seems that your step test is not done correctly.
First, the input data does not seem correlated to the output data throughout the experiment, see slide 9 (“Common Mistakes …”) of the following presentation:https://github.com/pidtuner/pidtuner.github.io/blob/master/assets/doc/PID%20Tuner.pdf
Second, it seems you are saturating your actuator, since the output looks like it achieves a constant growth speed instead of a natural growth curve. Maybe try a smaller step change.
Hope this information helps,
KeymasterBut the grayed out text precisely says “Use ctrl+V”, have you tried selecting the cell and then hitting ctrl+v ?
KeymasterHi,
We are happy you found the FAQ and tool useful. Let us know if you have an specific question in mind or if you need help with an specific data set that you are willing to share.
Best,
KeymasterHi,
Yes, it seems you need to modify the gains as you suggest. Also it seems your implementation does not have Derivative action, so when you choose a model in de pidtuner app, make sure is a first order model as to make sure Derivative action is zero.
Take a look to this presentation if you want more confidence that you are doing PID tuning correctly:
https://github.com/pidtuner/pidtuner.github.io/blob/master/assets/doc/PID%20Tuner.pdf
KeymasterThe error is the setpoint (SP) minus the process output (PV). The output column must contain the process output.
Every system (process and PID) has an input and an output. That is why it can be confusing. The PID has as input the error (SP-PV), and the control variable (CV) as output. The process has the CV as input and the PV as output.
What the PID tuner need as “input” is the CV and as “output” the PV. Because it is the input and output of the process. Hope this is clearer.
KeymasterThanks for you interest, regarding your questions:
Yes it could, the PID being a linear system, could also be “indentified”. Actually you can exchange the input for the output column and viceversa, and a model will come up trying to match the controller dynamics.
But only some common process models are supported by the tool. There is no “PID model” built into the software, so you won’t be able to “recover PID gains” from data with the software as-is. It could be done, but there no common use case for that, so it is not worth development time for me.
The most common case is what is presented, model the process, then use the model to obtain good PID gains as a good starting point for tuning the control loop.
KeymasterIt is a common question, and source of confusion. Maybe the following FAQ document can help you clarify the input/output selection:
https://github.com/pidtuner/pidtuner.github.io/blob/master/assets/doc/PID%20Tuner.pdf
The program is modeling the system process, not the controller. Try not to get confused by the names of the variables for any specific implementation, what the PIDTuner considers “input” is the input to the process (output of the PID). And what the PIDTuner considers “output” is the output of the process (input to the PID).
Hope the information above makes things a little clearer.
KeymasterHi,
Time is always in seconds. If your PID implementation is non-standard, you are responsible of converting the PID gains to the non-standard time frame used by your PID.
Same goes with the gains. The PID Tuner shows both Integral Gain and Integral Time because in industry either one or the other are standard. So if your PID accepts some custom transformed Integral term, you are responsible for converting it to your special PID form.
I have been working on a presentation that I will officially release soon, hopefully with a video. Maybe this will help you clarify some practical concepts:
KeymasterHi,
Thank you for your interest. The identification algorithm uses this solution:
https://math.stackexchange.com/questions/1428566/fit-sum-of-exponentials/3808325#3808325
Basically consists in integrating the inputs and outputs of the system (according to the desired model order) and then solving a couple of (linear) least squares problems.
The delay in nonlinear, so given that the (linear) least squares problems are “relatively cheap”, the delay is calculated by brute force initially using a grid of values. Then refinement is made using a simple newton method.
Hope this is helpful.
KeymasterHi,
I am happy you like the tool, the “Scale Gains” slider simply implements the Skogestad PID tuning rules.Cheers.
KeymasterHi,
Yes, they are indeed Ki, Kd and Kp, from the “parallel” or “ideal” form:
https://en.wikipedia.org/wiki/PID_controller#Standard_versus_parallel_(ideal)_form
Bear in mind that in most PID implementations, the “standard form” is the most common (the one that uses Ti and Td).
KeymasterApart from minimizing disturbances in the data, and making sure time is seconds, also make sure that the data must be the exact same values that go into the PID (process output) and out of the PID (process input).
I cannot stress this more, it is a very common mistake when using the tool, the data must be exactly what would come in and out of the PID block (of course in open-loop PID is disabled, but this is just to illustrate which are the signals that are needed).
Have a good tuning!
KeymasterHi, all time must be in seconds, always. The scale of the axis must the exact same that is used to feed in and read out of the PID block that will be used in your process loop.
KeymasterHi, yes all time must be in seconds. Your input step data is definitively weird.
It seems you are not introducing an “clean” open loop step response of your process. This can clearly be seen because when your input is zero, your process is responding to something, let’s call it “unmeasured disturbance”
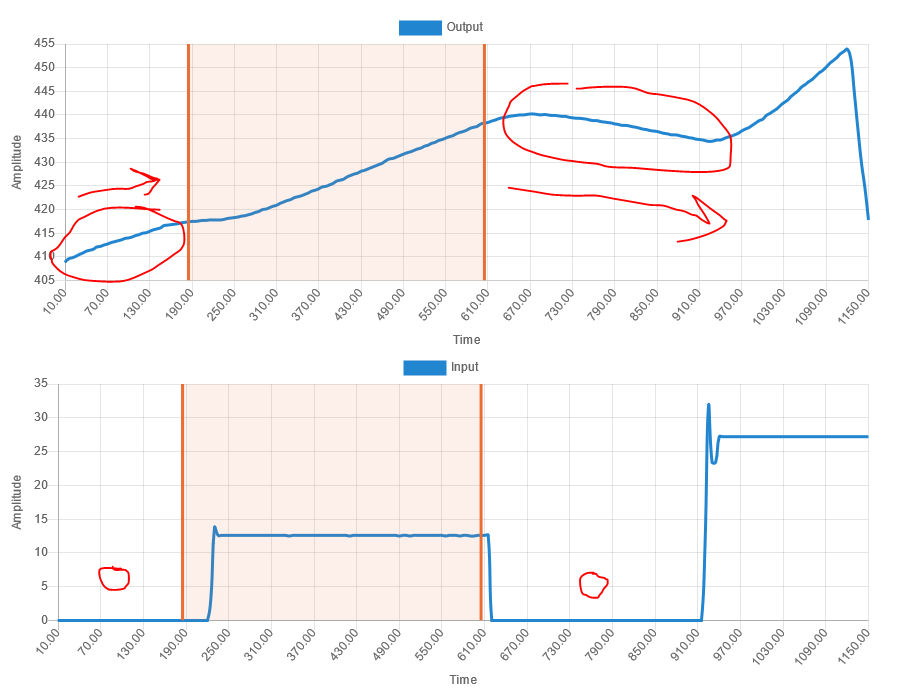
What is even more worrying is that before the first step, the unmeasured disturbance seem to be affecting the process with a positive slope, and after the first step, it is affecting with a negative slope. So it not a disturbance that can be de-trended.
To get a good model of your process, you need to record a “clean” open loop step (without external disturbances). If there are external forces driving your system, it will be very hard to obtain an accurate description on how your process input drives the process output.
That being said, this does not mean the pidtuner will not be useful to you. What it means is that you should be careful and realize that the simulation given by it will not be an accurate one, because of the unclean data you gave to it.
If you have no way of performing a “clean” open loop step response experiment, I would use this data, but then de-tune the gains given by the pidtuner (slider to the left) and use it as a starting point for tuning. Then increase the performance slowly until satisfactory results are obtained. This is the price of uncertainty in control.
-
AuthorPosts